ANALYSIS OF NOISE
POLLUTION IN RANCHI
Prepared By- Arnab Kumar Das, Atiya Darakshan, Isha Mukherjee, Mampi Banerjee,
Manorama Kumari and Shruti Ghosh
Manorama Kumari and Shruti Ghosh
The Jharkhand State Pollution Control Board is the regulatory and analysing body for the different levels
of Sound (Noise) Pollution in the different areas of Ranchi. The data was collected by us from there and
was self-analysed Following were the conclusions obtained which are represented graphically for proper
understanding.
of Sound (Noise) Pollution in the different areas of Ranchi. The data was collected by us from there and
was self-analysed Following were the conclusions obtained which are represented graphically for proper
understanding.
LEVELS OF SOUND IN DIFFERENT AREAS
IN RANCHI ON 5/6/2017
| AREA | SOUND LEVELS (in dB) | 
|
|||||||||||||||||
| AVERAGE | LIMIT | ||||||||||||||||||
| INDUSTRIAL AREA, TUPUDANA | 69.5 | 75 | |||||||||||||||||
| HATIA MARKET | 64.8 | 65 | |||||||||||||||||
| NEAR PROJECT BUILDING | 55.75 | 65 | |||||||||||||||||
| SEC-3, HEC COMPLEX | 54.5 | 55 | |||||||||||||||||
| BIRSA CHOWK | 66.95 | 65 | |||||||||||||||||
| NEAR HIGH COURT, DORANDA | 54.25 | 50 | |||||||||||||||||
| NEAR SUJATA CINEMA | 70.83 | 65 | |||||||||||||||||
| NEAR GEL CHRUCH COMPLEX | 68 | 65 | |||||||||||||||||
| NEAR ALBERT EKKA CHOWK | 77.4 | 65 | |||||||||||||||||
| NEAR KUTCHERY | 69.42 | 65 | |||||||||||||||||
| LALPUR CHOWK, RANCHI | 70.92 | 65 | |||||||||||||||||
| KANTA TOLI CHOWK | 72.45 | 65 | |||||||||||||||||
| RIIMS, RANCHI | 49.8 | 50 | |||||||||||||||||
| NEAR GOVERNER HOUSE | 66.22 | 65 | |||||||||||||||||
| RATU ROAD CHOWK | 71.27 | 65 | |||||||||||||||||
| NEAR PISKA MORE CHOWK | 70.3 | 55 | |||||||||||||||||
| ARGORA CHOWK | 68.4 | 55 | |||||||||||||||||
| ASHOK NAGAR | 53.4 | 55 | |||||||||||||||||
| MECON COLONY | 51.9 | 55 | |||||||||||||||||
LEVELS OF SOUND IN DIFFERENT
AREAS IN RANCHI ON 27/9/2017
| |||||||||||||||||||
| AREA | SOUND LEVELS (in dB) |
 | |||||||||||||||||
| AVERAGE | LIMIT | ||||||||||||||||||
| INDUSTRIAL AREA, TUPUDANA | 71.9 | 75 | |||||||||||||||||
| HATIA MARKET | 75.8 | 65 | |||||||||||||||||
| NEAR PROJECT BUILDING | 66.35 | 65 | |||||||||||||||||
| SEC-3, HEC COMPLEX | 67.45 | 55 | |||||||||||||||||
| BIRSA CHOWK | 80.12 | 65 | |||||||||||||||||
| NEAR HIGH COURT, DORANDA | 62.4 | 50 | |||||||||||||||||
| NEAR SUJATA CINEMA | 77.2 | 65 | |||||||||||||||||
| NEAR GEL CHRUCH COMPLEX | 73.8 | 65 | |||||||||||||||||
| NEAR ALBERT EKKA CHOWK | 79.9 | 65 | |||||||||||||||||
| NEAR KUTCHERY | 76.3 | 65 | |||||||||||||||||
| LALPUR CHOWK, RANCHI | 76.2 | 65 | |||||||||||||||||
| KANTA TOLI CHOWK | 77.9 | 65 | |||||||||||||||||
| RIIMS, RANCHI | 49.1 | 50 | |||||||||||||||||
| NEAR GOVERNER HOUSE | 70.7 | 65 | |||||||||||||||||
| RATU ROAD CHOWK | 77.12 | 65 | |||||||||||||||||
| NEAR PISKA MORE CHOWK | 70.1 | 65 | |||||||||||||||||
| ARGORA CHOWK | 72.95 | 55 | |||||||||||||||||
| ASHOK NAGAR | 64.6 | 55 | |||||||||||||||||
| MECON COLONY | 68.7 | 55 | |||||||||||||||||
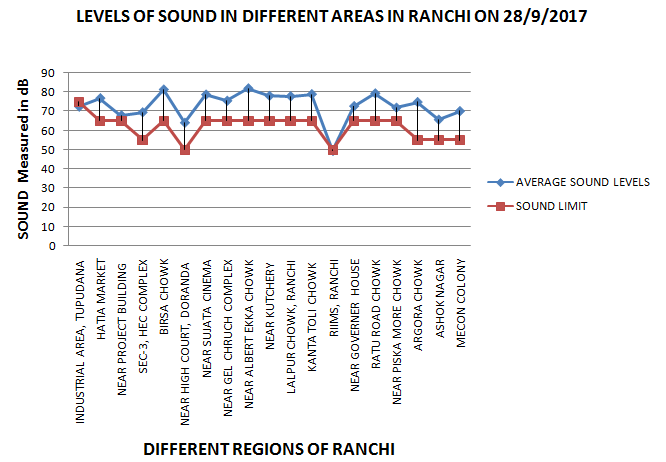
LEVELS OF SOUND IN DIFFERENT
AREAS IN RANCHI ON 28/9/2017
|
|||||||||||||||||||
| AREA | SOUND LEVELS (in dB) |
 |
|||||||||||||||||
| AVERAGE | LIMIT | ||||||||||||||||||
| INDUSTRIAL AREA, TUPUDANA | 72.5 | 75 | |||||||||||||||||
| HATIA MARKET | 76.9 | 65 | |||||||||||||||||
| NEAR PROJECT BUILDING | 68 | 65 | |||||||||||||||||
| SEC-3, HEC COMPLEX | 69.6 | 55 | |||||||||||||||||
| BIRSA CHOWK | 81.4 | 65 | |||||||||||||||||
| NEAR HIGH COURT, DORANDA | 64.2 | 50 | |||||||||||||||||
| NEAR SUJATA CINEMA | 78.8 | 65 | |||||||||||||||||
| NEAR GEL CHRUCH COMPLEX | 75.6 | 65 | |||||||||||||||||
| NEAR ALBERT EKKA CHOWK | 82 | 65 | |||||||||||||||||
| NEAR KUTCHERY | 78.1 | 65 | |||||||||||||||||
| LALPUR CHOWK, RANCHI | 77.9 | 65 | |||||||||||||||||
| KANTA TOLI CHOWK | 79 | 65 | |||||||||||||||||
| RIIMS, RANCHI | 49.6 | 50 | |||||||||||||||||
| NEAR GOVERNER HOUSE | 72.8 | 65 | |||||||||||||||||
| RATU ROAD CHOWK | 79.4 | 65 | |||||||||||||||||
| NEAR PISKA MORE CHOWK | 72 | 65 | |||||||||||||||||
| ARGORA CHOWK | 74.9 | 55 | |||||||||||||||||
| ASHOK NAGAR | 65.8 | 55 | |||||||||||||||||
| MECON COLONY | 70.2 | 55 | |||||||||||||||||
LEVELS OF SOUND IN DIFFERENT REGIONS
OF RANCHI ON 30/01/2016
|
|||||||||||||||||||
| AREA | SOUND LEVELS (in dB) |

|
|||||||||||||||||
| AVERAGE | LIMIT | ||||||||||||||||||
| Industrial Area , Tupudana | 69.4 | 75 | |||||||||||||||||
| Hatia market | 73.4 | 65 | |||||||||||||||||
| Near project building | 67.2 | 65 | |||||||||||||||||
| Sector-3 HEC Complex | 53.8 | 55 | |||||||||||||||||
| Birsa Chowk | 76 | 65 | |||||||||||||||||
| Near High Court , Doranda | 64.5 | 50 | |||||||||||||||||
| Near Sujata Cinema | 74.2 | 65 | |||||||||||||||||
| Near GEL Church Complex | 73.8 | 65 | |||||||||||||||||
| Near Albert Ekka Chowk | 75.8 | 65 | |||||||||||||||||
| Near Kutc hery | 72.2 | 65 | |||||||||||||||||
| Lalpur Chowk | 75.8 | 65 | |||||||||||||||||
| Kantatoli chowk | 77 | 65 | |||||||||||||||||
| RIIMS, Ranchi | 47.8 | 50 | |||||||||||||||||
| Near Governor House, Kanke | 68.4 | 65 | |||||||||||||||||
| Ratu Road Chowk | 73.1 | 65 | |||||||||||||||||
| Argora Chowk | 70.2 | 65 | |||||||||||||||||
| Ashok Nagar | 49.6 | 55 | |||||||||||||||||
| Mecon Colony | 49.2 | 55 | |||||||||||||||||
LEVELS OF SOUND IN DIFFERENT
REGIONS OF RANCHI ON 5/06/2016
|
|||||||||||||||||||

|
|||||||||||||||||||
| AREA | SOUND LEVELS (in dB) | ||||||||||||||||||
| AVERAGE | LIMIT | ||||||||||||||||||
| Industrial Area , Tupudana | 67.5 | 75 | |||||||||||||||||
| Hatia market | 72.8 | 65 | |||||||||||||||||
| Near project building | 66.2 | 65 | |||||||||||||||||
| Sector-3 HEC Complex | 51.5 | 55 | |||||||||||||||||
| Birsa Chowk | 73.9 | 65 | |||||||||||||||||
| Near High Court , Doranda | 64.2 | 50 | |||||||||||||||||
| Near Sujata Cinema | 77.3 | 65 | |||||||||||||||||
| Near GEL Church Complex | 75.8 | 65 | |||||||||||||||||
| Near Albert Ekka Chowk | 76.5 | 65 | |||||||||||||||||
| Near Kutc hery | 74.9 | 65 | |||||||||||||||||
| Lalpur Chowk | 76.1 | 65 | |||||||||||||||||
| Kantatoli chowk | 76.2 | 65 | |||||||||||||||||
| RIIMS, Ranchi | 49.3 | 50 | |||||||||||||||||
| Near Governor House, Kanke | 69.1 | 65 | |||||||||||||||||
| Ratu Road Chowk | 76.2 | 65 | |||||||||||||||||
| Argora Chowk | 72.9 | 65 | |||||||||||||||||
| Ashok Nagar | 50.8 | 55 | |||||||||||||||||
| Mecon Colony | 51.5 | 55 | |||||||||||||||||
LEVELS OF SOUND IN DIFFERENT
REGIONS OF RANCHI ON 30/5/2016
|
|||||||||||||||||||
| AREA | SOUND LEVELS (in dB) | ||||||||||||||||||
| AVERAGE | LIMIT |

|
|||||||||||||||||
| Industrial Area , Tupudana | 69.2 | 75 | |||||||||||||||||
| Hatia market | 73.6 | 65 | |||||||||||||||||
| Near project building | 68.8 | 65 | |||||||||||||||||
| Sector-3 HEC Complex | 51.9 | 55 | |||||||||||||||||
| Birsa Chowk | 74.4 | 65 | |||||||||||||||||
| Near High Court , Doranda | 64.8 | 50 | |||||||||||||||||
| Near Sujata Cinema | 77.3 | 65 | |||||||||||||||||
| Near GEL Church Complex | 74.8 | 65 | |||||||||||||||||
| Near Albert Ekka Chowk | 76.1 | 65 | |||||||||||||||||
| Near Kutc hery | 76.3 | 65 | |||||||||||||||||
| Lalpur Chowk | 76.4 | 65 | |||||||||||||||||
| Kantatoli chowk | 76.5 | 65 | |||||||||||||||||
| RIIMS, Ranchi | 49.4 | 50 | |||||||||||||||||
| Near Governor House, Kanke | 69.1 | 65 | |||||||||||||||||
| Ratu Road Chowk | 77.8 | 65 | |||||||||||||||||
| Argora Chowk | 72.8 | 65 | |||||||||||||||||
| Ashok Nagar | 48.4 | 55 | |||||||||||||||||
| Mecon Colony | 50.2 | 55 | |||||||||||||||||
LEVELS OF SOUND IN DIFFERENT
REGIONS OF RANCHI ON 10/8/2016
|
|||||||||||||||||||

|
|||||||||||||||||||
| AREA | SOUND LEVELS (in dB) | ||||||||||||||||||
| AVERAGE | LIMIT | ||||||||||||||||||
| Industrial Area , Tupudana | 68.8 | 75 | |||||||||||||||||
| Hatia market | 70.6 | 65 | |||||||||||||||||
| Near project building | 66.2 | 65 | |||||||||||||||||
| Sector-3 HEC Complex | 54.2 | 55 | |||||||||||||||||
| Birsa Chowk | 73.1 | 65 | |||||||||||||||||
| Near High Court , Doranda | 66.8 | 50 | |||||||||||||||||
| Near Sujata Cinema | 72.6 | 65 | |||||||||||||||||
| Near GEL Church Complex | 74 | 65 | |||||||||||||||||
| Near Albert Ekka Chowk | 76.2 | 65 | |||||||||||||||||
| Near Kutc hery | 72.8 | 65 | |||||||||||||||||
| Lalpur Chowk | 75.8 | 65 | |||||||||||||||||
| Kantatoli chowk | 76.8 | 65 | |||||||||||||||||
| RIIMS, Ranchi | 49.2 | 50 | |||||||||||||||||
| Near Governor House, Kanke | 68.4 | 65 | |||||||||||||||||
| Ratu Road Chowk | 73.5 | 65 | |||||||||||||||||
| Argora Chowk | 70.2 | 65 | |||||||||||||||||
| Ashok Nagar | 49.8 | 55 | |||||||||||||||||
| Mecon Colony | 87.7 | 55 | |||||||||||||||||
| ||||||||||||||||||||||||||||||||||
SUMMARY AND REPORT ON SURVEY ON SOUND POLLUTION
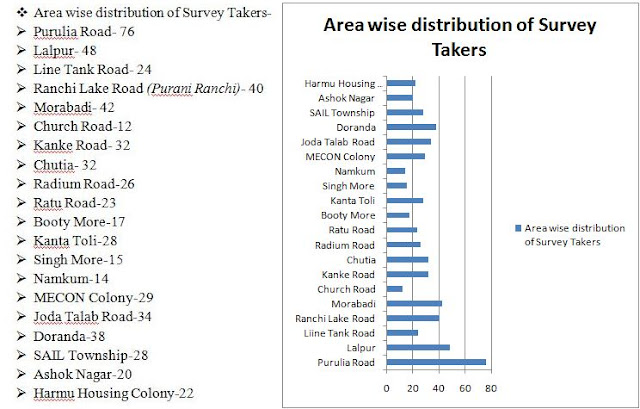
An online survey was conducted in which a handsome number of Ranchites participated.
Following is a report and summary on the basis of data obtained by those who took the survey.
v Total
no. of people participated- 90
v Total
no of questions asked- 12
v Questions
Asked-
Statistical Graphical
Representation Based on Data Provided by those who took the survey-
§
Locality-

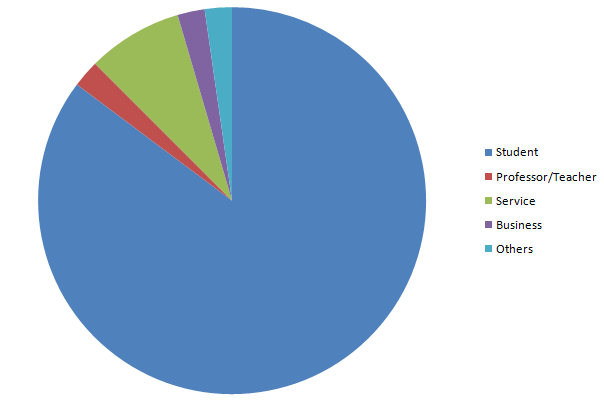
§ Occupation-
§ Since
how many years are you living at this place-

§ Level
of Sound Experienced-

§ Time
of day when you think sound level is highest-

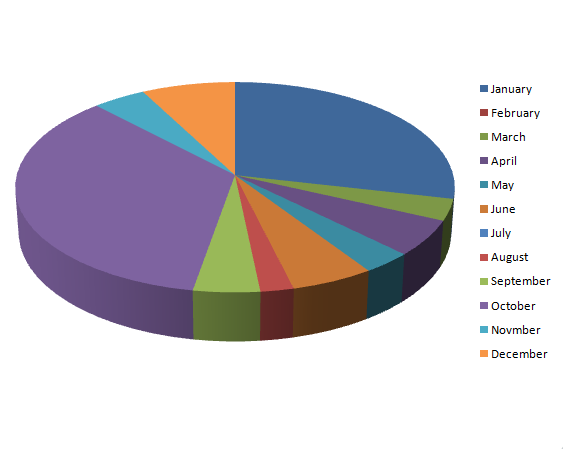
§ Month
of Year when sound level is highest-
§ Has
sound level risen over the years-

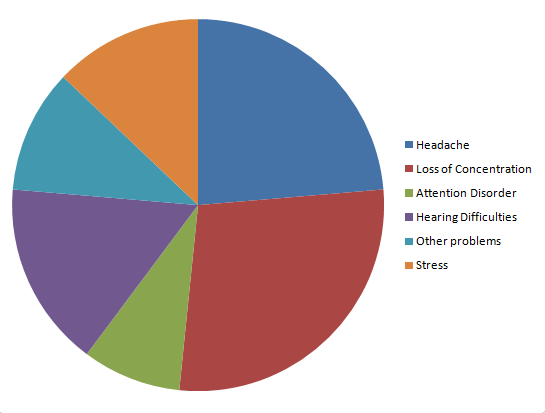
§ Problems
faced due to increased level of sound (noise)-
§ Possible
reasons for increase in sound over the years-

§ Suggestions to control/reduce the high level of
sound (noise) prevalent in Ranchi-

§ What would you want to do on individual level to
reduce sound (noise) pollution-

Localities of Ranchi vs Level of Sound (On the rating of 1 to 10)-
 | ||||||||||||||||||||||||||||||||||


