Thursday 25 October 2018


REPORT OF SURVEY UNDERTAKEN FOR WATER POLLUTION OF FIVE MAJOR PONDS OF RANCHI,JHARKHAND

By- Arnab Kumar Das, Isha Mukherjee and Shruti Ghosh

The students of Department-of-Zoology of St. Xavier’s College, Ranchi- Arnab Kumar Das, Isha Mukherjee and Shruti Ghosh conducted a survey to know common peoples’ opinion on water pollution of five major ponds located in different areas of Ranchi viz.,  Bada Talab, Line Tank Talab, Banas Talab, Batam Talab and Joda Talab. Survey was conducted from 9th August,2018 to 16th September,2018 in which 600 people from different areas of Ranchi participated. This survey work was done under the guidance of Dr. Bharti Singh Raipat, H.O.D., Department of Zoology and Mr. Manoj Kumar as well as Dr. Manoj Kumar.
Following is the detailed report and analysis of the survey-


v Reasons cited for water body being polluted (Lake Wise)-

Ø Ranchi Lake-
a)     Bathing and Washing of vehicles near the embankments
b)    Dumping of waste materials by the people
c)     Dumping of Bio-medical waste by a hospital located nearby
d)    Immersion of Idols
e)     Immersion of old puja goods
f)      Construction activities by local authorities
g)     Absence of periodical cleaning by concerned authorities

Ø Line Tank Lake-
a)     Bathing and washing of clothes near the embankments
b)    Dumping of garbage
c)     Pisciculture
d)    Absence of periodical cleaning
e)     Immersion of Idols

v Banas Talab-
a)     Bathing and washing of clothes by local people
b)    Dumping of waste materials
c)     Immersion of Idols
d)    Immersion of old puja goods
e)     Pisciculture
f)      Absence of periodical cleaning by local authorities

v Joda Talab-
a)     Bathing and washing of clothes by local people
b)    Lack of civic sence by local authorities
c)     Immersion of Idols


v Have water pollution levels increased in water bodies of Ranchi-
Ø 528 people- Yes
Ø 72 people- No
v Do common people also contribute to water pollution-

·        582 people- Yes
·        18 people- No
v Rankings of  Water Bodies according to pollution levels as rated by people-

1)    212 People- Ranchi Lake (Bada Talab)
2)    180 People- Line Tank Pond
3)    122 People- Batam Talab
4)    66 People- Banas Talab
5)    20 People- Joda Talab
v Are measures taken by government enough to curb the meance of water pollution-
Ø 558 people- No
Ø 42 people- Yes
v Colouration of water bodies as reported by people-
Ø Ranchi Lake (Bada Talab)- Greenish
Ø Line Tank Pond- Greenish-Yellow
Ø Joda Talab- Greenish
Ø Banas Talab- Greenish
Ø Batam Talab- Greenish

v How does water pollution affects the survey taker on individual and collective levels-

Ø On individual level-
a)     Dirty water bodies give foul odour
b)    Water becomes unfit for usage
c)     Causes itching when bathed

Ø On Collective level-
a)     Dirty water bodies are sites for mosquito breeding
b)    Causes skin disorders in longer run
c)     Fish thriving in waters will get affected and so will the people who will eat it
d)    In longer run, water will become unfit for any usage
v Reasons for increase in water pollution over the years in water bodies of Ranchi according to survey takers-
a)     Overpopulation
b)    Lack of civic sense among people
c)     Ignorance by government authorities

v Suggestions of people to reduce the water pollution in the waters of aquatic bodies of Ranchi and in the vicinity of Ranchi-
a)     Awareness campaigns and cleanliness drives should be carried on a regular basis
b)    Strict laws should be framed by people of authority and implemented
c)     Common people should also volunteer
d)    Garbage catcher nets should be installed from a few distance away from the embankments.
SUMMARY
The students of Department-of-Zoology of St. Xavier’s College- Arnab Kumar Das, Isha Mukherjee and Shruti Ghosh conducted a survey to know common peoples’ opinion on water pollution of five major ponds located in different areas of Ranchi viz.,  Bada Talab, Line Tank Talab, Banas Talab, Batam Talab and Joda Talab. The survey was conducted during the months of August and September and 600 people from different localities of Ranchi participated in it. According to the data received by survey takers, Bada Talab was found to be the most polluted pond whereas Joda Talab was the least polluted one. Dumping of waste materials, bathing and washing of clothes near the embankments, immersion of idols and discharge of run-off water into the ponds from various sources were the chief reasons of pollution of these ponds. Some people had the opinion that construction of embankments and boundary walls around the ponds have decreased the opportunity of throwing waste materials into the ponds which will result in a gradual decrease in pollution level over a period of time. Due to considerable pollution levels, the people who are dependent on these ponds suffer from various water borne diseases and skin disorders. Therefore, to curb the menace of pollution of ponds, survey takers believed that besides government and local authorities, the participation of common man is need of the hour. To ensure people’s participation, cleanliness drives and awareness campaigns should be organized from time to time. This survey work was done under the guidance of  Dr. Bharti Singh Raipat, H.O.D., Department of Zoology and Mr. Manoj Kumar.

v The survey work was also covered by Dainik Jagran Ranchi and Dainik Jharkhand online web portal as well.


Sunday 14 January 2018


ANALYSIS OF NOISE POLLUTION IN RANCHI

Prepared By- Arnab Kumar Das, Atiya Darakshan, Isha Mukherjee, Mampi Banerjee, 
Manorama Kumari and Shruti Ghosh

The Jharkhand State Pollution Control Board is the regulatory and analysing body for the different levels
of Sound (Noise) Pollution in the different areas of Ranchi. The data was collected by us from there and
was self-analysed Following were the conclusions obtained which are represented graphically for proper
understanding.

LEVELS OF SOUND IN DIFFERENT AREAS IN RANCHI ON 5/6/2017

AREA SOUND LEVELS (in dB)
AVERAGE LIMIT
INDUSTRIAL AREA, TUPUDANA 69.5 75
HATIA MARKET 64.8 65
NEAR PROJECT BUILDING  55.75 65
SEC-3, HEC COMPLEX 54.5 55
BIRSA CHOWK 66.95 65
NEAR HIGH COURT, DORANDA  54.25 50
NEAR SUJATA CINEMA 70.83 65
NEAR GEL CHRUCH COMPLEX 68 65
NEAR ALBERT EKKA CHOWK 77.4 65
NEAR KUTCHERY  69.42 65
LALPUR CHOWK, RANCHI 70.92 65
KANTA TOLI CHOWK  72.45 65
RIIMS, RANCHI 49.8 50
NEAR GOVERNER HOUSE 66.22 65
RATU ROAD CHOWK 71.27 65
NEAR PISKA MORE CHOWK 70.3 55
ARGORA CHOWK 68.4 55
ASHOK NAGAR 53.4 55
MECON COLONY 51.9 55
LEVELS OF SOUND IN DIFFERENT AREAS IN RANCHI ON 27/9/2017
AREA SOUND LEVELS (in dB)

AVERAGE LIMIT
INDUSTRIAL AREA, TUPUDANA 71.9 75
HATIA MARKET 75.8 65
NEAR PROJECT BUILDING  66.35 65
SEC-3, HEC COMPLEX 67.45 55
BIRSA CHOWK 80.12 65
NEAR HIGH COURT, DORANDA  62.4 50
NEAR SUJATA CINEMA 77.2 65
NEAR GEL CHRUCH COMPLEX 73.8 65
NEAR ALBERT EKKA CHOWK 79.9 65
NEAR KUTCHERY  76.3 65
LALPUR CHOWK, RANCHI 76.2 65
KANTA TOLI CHOWK  77.9 65
RIIMS, RANCHI 49.1 50
NEAR GOVERNER HOUSE 70.7 65
RATU ROAD CHOWK 77.12 65
NEAR PISKA MORE CHOWK 70.1 65
ARGORA CHOWK 72.95 55
ASHOK NAGAR 64.6 55
MECON COLONY 68.7 55
LEVELS OF SOUND IN DIFFERENT AREAS IN RANCHI ON 28/9/2017
AREA SOUND LEVELS (in dB)

AVERAGE LIMIT
INDUSTRIAL AREA, TUPUDANA 72.5 75
HATIA MARKET 76.9 65
NEAR PROJECT BUILDING  68 65
SEC-3, HEC COMPLEX 69.6 55
BIRSA CHOWK 81.4 65
NEAR HIGH COURT, DORANDA  64.2 50
NEAR SUJATA CINEMA 78.8 65
NEAR GEL CHRUCH COMPLEX 75.6 65
NEAR ALBERT EKKA CHOWK 82 65
NEAR KUTCHERY  78.1 65
LALPUR CHOWK, RANCHI 77.9 65
KANTA TOLI CHOWK  79 65
RIIMS, RANCHI 49.6 50
NEAR GOVERNER HOUSE 72.8 65
RATU ROAD CHOWK 79.4 65
NEAR PISKA MORE CHOWK 72 65
ARGORA CHOWK 74.9 55
ASHOK NAGAR 65.8 55
MECON COLONY 70.2 55
LEVELS OF SOUND IN DIFFERENT REGIONS OF RANCHI ON 30/01/2016 
AREA SOUND LEVELS (in dB)

AVERAGE LIMIT
Industrial  Area , Tupudana 69.4 75
Hatia market 73.4 65
 Near project building 67.2 65
Sector-3 HEC Complex  53.8 55
 Birsa Chowk  76 65
Near High Court , Doranda  64.5 50
Near Sujata  Cinema 74.2 65
Near GEL Church Complex 73.8 65
Near Albert Ekka Chowk 75.8 65
 Near Kutc hery 72.2 65
Lalpur Chowk  75.8 65
Kantatoli chowk 77 65
RIIMS, Ranchi 47.8 50
Near Governor House, Kanke 68.4 65
Ratu Road  Chowk 73.1 65
Argora Chowk 70.2 65
Ashok Nagar 49.6 55
Mecon Colony 49.2 55
LEVELS OF SOUND IN DIFFERENT REGIONS OF RANCHI ON 5/06/2016


AREA SOUND LEVELS (in dB)
AVERAGE LIMIT
Industrial  Area , Tupudana 67.5 75
Hatia market 72.8 65
 Near project building 66.2 65
Sector-3 HEC Complex  51.5 55
 Birsa Chowk  73.9 65
Near High Court , Doranda  64.2 50
Near Sujata  Cinema 77.3 65
Near GEL Church Complex 75.8 65
Near Albert Ekka Chowk 76.5 65
 Near Kutc hery 74.9 65
Lalpur Chowk  76.1 65
Kantatoli chowk 76.2 65
RIIMS, Ranchi 49.3 50
Near Governor House, Kanke 69.1 65
Ratu Road  Chowk 76.2 65
Argora Chowk 72.9 65
Ashok Nagar 50.8 55
Mecon Colony 51.5 55
LEVELS OF SOUND IN DIFFERENT REGIONS OF RANCHI ON 30/5/2016
AREA SOUND LEVELS (in dB)
AVERAGE LIMIT

Industrial  Area , Tupudana 69.2 75
Hatia market 73.6 65
 Near project building 68.8 65
Sector-3 HEC Complex  51.9 55
 Birsa Chowk  74.4 65
Near High Court , Doranda  64.8 50
Near Sujata  Cinema 77.3 65
Near GEL Church Complex 74.8 65
Near Albert Ekka Chowk 76.1 65
 Near Kutc hery 76.3 65
Lalpur Chowk  76.4 65
Kantatoli chowk 76.5 65
RIIMS, Ranchi 49.4 50
Near Governor House, Kanke 69.1 65
Ratu Road  Chowk 77.8 65
Argora Chowk 72.8 65
Ashok Nagar 48.4 55
Mecon Colony 50.2 55
LEVELS OF SOUND IN DIFFERENT REGIONS OF RANCHI ON 10/8/2016


AREA SOUND LEVELS (in dB)
AVERAGE LIMIT
Industrial  Area , Tupudana 68.8 75
Hatia market 70.6 65
 Near project building 66.2 65
Sector-3 HEC Complex  54.2 55
 Birsa Chowk  73.1 65
Near High Court , Doranda  66.8 50
Near Sujata  Cinema 72.6 65
Near GEL Church Complex 74 65
Near Albert Ekka Chowk 76.2 65
 Near Kutc hery 72.8 65
Lalpur Chowk  75.8 65
Kantatoli chowk 76.8 65
RIIMS, Ranchi 49.2 50
Near Governor House, Kanke 68.4 65
Ratu Road  Chowk 73.5 65
Argora Chowk 70.2 65
Ashok Nagar 49.8 55
Mecon Colony 87.7 55


COMPARISION OF LEVELS OF SOUND


SUMMARY AND REPORT ON SURVEY ON SOUND POLLUTION

An online survey was conducted in which a handsome number of Ranchites participated. 
Following is a report and summary on the basis of data obtained by those who took the survey.

v  Total no. of people participated- 90
v  Total no of questions asked- 12

v  Questions Asked-

  1.   Name
  2. Area of Ranchi where you live?
  3.   Occupation
  4.   Since how many years are you living at this place?
  5.   What is the level of sound (noise) you experience everyday?
  6.   During what time of the day, you feel that the sound level is at the highest point?
  7.   During which month of the year you feel that the level of sound is highest in your locality?
  8.   Do you think that in recent years the level of Sound (Noise) has risen?
  9.   What problems do you face because of increased level of sound (noise)?
  10.   According to you what are the possible reasons for increase in level of sound over the years?
  11.   What are your suggestions to control/reduce the high level of sound (noise) prevalent in Ranchi?
  12.   What would you want to do on individual level to reduce sound (noise) pollution?
Statistical Graphical Representation Based on Data Provided by those who took the survey-
§ 
Locality-


§  Occupation-

§  Since how many years are you living at this place-

§  Level of Sound Experienced-


§  Time of day when you think sound level is highest-

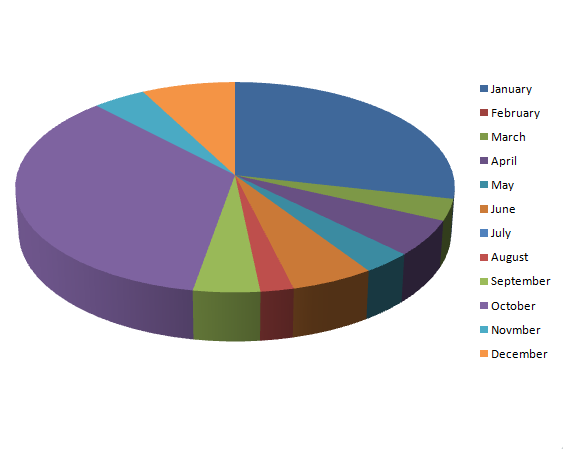
§  Month of Year when sound level is highest-

§  Has sound level risen over the years-


§  Problems faced due to increased level of sound (noise)-


§  Possible reasons for increase in sound over the years-

§  Suggestions to control/reduce the high level of sound (noise) prevalent in Ranchi-


§  What would you want to do on individual level to reduce sound (noise) pollution-

 Localities of Ranchi vs Level of Sound (On the rating of 1 to 10)-


REPORT OF SURVEY UNDERTAKEN FOR WATER POLLUTION OF FIVE MAJOR PONDS OF RANCHI,JHARKHAND By- Arnab Kumar Das, Isha Mukherjee and Shruti ...